Nutritional Requirements
The construction of rations for suckler beef relies on essentially the same information required for all ruminants.
- The liveweight of the animal.
- The targeted level of production. (daily liveweight gain)
- The type of production required. (growth, finish)
Once these parameters have been assessed the ration nutrient requirements essential to produce the target level of performance need to be calculated.
- Dry Matter Intake.
The calculation of this figure has been the subject of much debate. It is derived from the liveweight, body condition, breed, sex, chosen feeding system, general digestibility, palatability, forage quality, and amount of concentrates; and the way all of these interact.
As a rule of thumb, the figures in Tables 5a to 5e should be used.
Table 5a
Dry Matter Intakes of Growing Cattle
| – | Dry Matter Intake | Percentage Variation |
| 100Kg | 2.2 | up to plus or minus 20% |
| 300Kg | 5.7 | up to plus or minus 25% |
| 500Kg | 8.6 | up to plus or minus 25% |
Table 5aa
Modified to 2.10% body weight (Jerry Trowbridge 2001/2020)
| – | Dry Matter Intake | Percentage Variation |
| 100Kg | 2.1 | up to plus or minus 10% |
| 300Kg | 6.3 | up to plus or minus 15% |
| 500Kg | 10.5 | up to plus or minus 20% |
Table 5b
Modified to 2.10% body weight (Jerry Trowbridge 2001/2020)
Hay and Straw
| – | Hay | Straw | Concentrates | |||
| ME (MJ/Kg DM | 10 | 9 | 8 | 7.5 | 6.5 | 12.5 |
| Liveweight (Kg) | Feed intake (Kg DM per day) | |||||
| 100 | 2.5 | 2.3 | 2.1 | 2.0 | 1.8 | 2.9 |
| 200 | 4.6 | 4.2 | 3.8 | 3.6 | 3.2 | 5.1 |
| 300 | 6.3 | 5.7 | 5.1 | 4.8 | 4.2 | 7.2 |
| 400 | 7.7 | 6.8 | 6.1 | 5.7 | 5.0 | 8.7 |
| 500 | 8.9 | 7.8 | 6.9 | 6.4 | 5.5 | 9.5 |
| Reduction of forage DM per Kg Concentrate DM (Kg) | 0.6 | 0.5 | 0.4 | 0.2 | 0.2 | – |
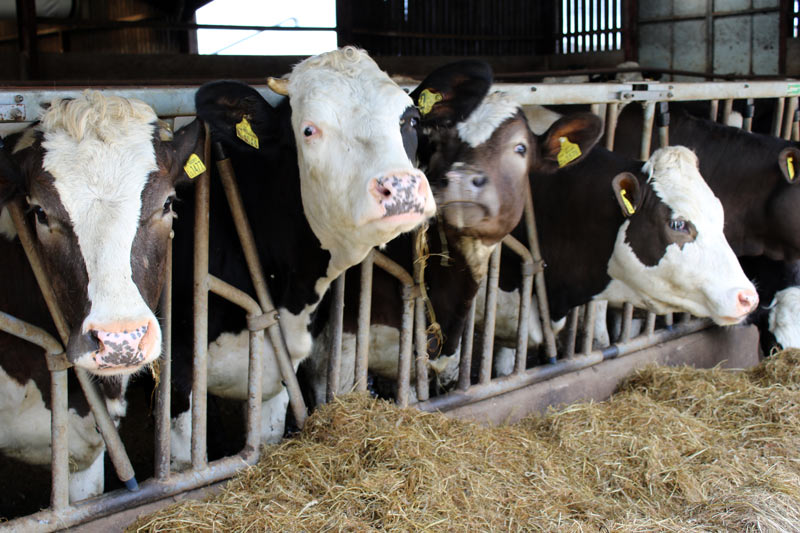
Table 5c
Feed intakes for growing cattle fed to appetite
Grass and maize silages
| – | Maize Silage | ||||||
| ME (MJ/Kg DM) | 11 | 10 | 9 | 11 | |||
| Fermentation | Good | Poor | Good | Poor | Good | Poor | – |
| Liveweight (Kg) | Feed intake (Kg Dry Matter per day) | ||||||
| 100 | 2.6 | 2.3 | 2.4 | 2.1 | 2.2 | 1.9 | 2.7 |
| 200 | 4.8 | 4.2 | 4.4 | 3.9 | 4.0 | 3.5 | 5.0 |
| 300 | 6.6 | 5.8 | 6.0 | 5.3 | 5.4 | 4.7 | 6.9 |
| 400 | 8.0 | 7.0 | 7.4 | 6.5 | 6.4 | 5.6 | 8.4 |
| 500 | 9.1 | 8.0 | 8.6 | 7.5 | 7.2 | 6.4 | 9.7 |
| Reduction in forage DM per Kg concentrate DM (Kg) | 0.6 | 0.5 | 0.5 | 0.4 | 0.4 | 0.3 | 0.6 |
Note:
We have seen cases of growing cattle being able to consume up to 12.5 Kg DM on easy access maize and grass silages where the presentation is good and the trough space per beast is adequate.
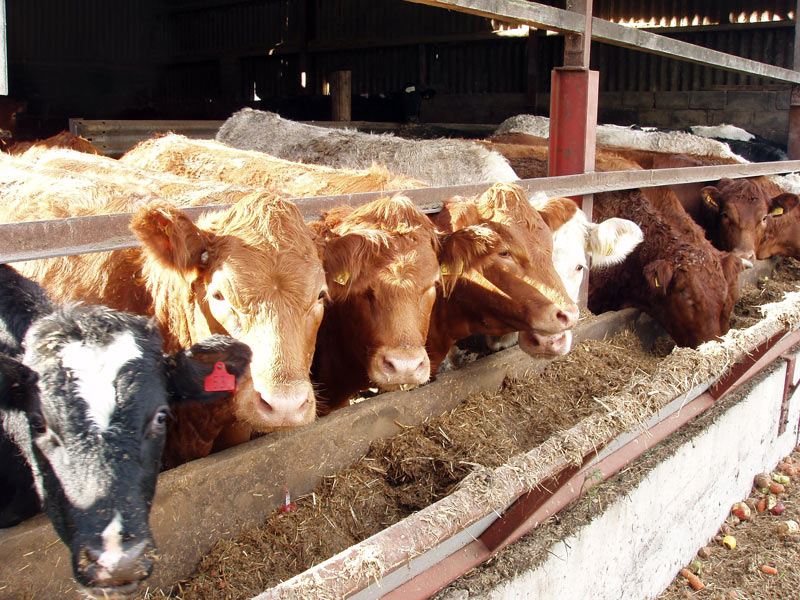
Unless ad-lib feeding is available, adequate space should be provided for all stock to feed simultaneously. This will prevent more dominant animals bullying more timid animals. Pregnant cows should be allowed extra space.
Table XX shows minimum feeding space requirements for different weights of cattle for both ration fed stock and stock fed ad-lib. We would suggest a slightly more generous allowance.
Table XX
| Mass of animal(kg) | Ration fed, Feed barrier width (mm/animal) | Ad-lib fed, Feed barrier width (mm/animal) |
| 200 | 400 | 150 |
| 300 | 500 | 150 |
| 400 | 550 | 190 |
| 500 | 600 | 240 |
| 600 | 670 | 280 |
| 700 | 700 | 320 |
| 800 | 800 | 340 |
Feed intakes for suckler cows are very closely linked to forage quality. Good quality silage may have to be limited to prevent cows from getting too fat.
Table 5d
Dry matter intakes for suckler cows
(Grass Silage)
| ME (MJ/Kg DM) | 11 | 10 | 9 | |||
| Fermentation | Good | Poor | Good | Poor | Good | Poor |
| Liveweight (Kg) | Feed intake (Kg Dry Matter per day) | |||||
| Lactating Cows | – | – | – | – | – | – |
| 450 | 9.5 | 8.5 | 8.8 | 7.8 | 8.1 | 7.2 |
| 550 | 11.6 | 10.3 | 10.7 | 9.5 | 9.9 | 8.8 |
| 650 | 13.7 | 12.2 | 12.7 | 11.3 | 11.7 | 10.4 |
| Dry Cows | – | – | – | – | – | – |
| 450 | 8.6 | 7.7 | 7.7 | 6.8 | 6.8 | 6.1 |
| 550 | 10.5 | 9.5 | 9.4 | 8.4 | 8.3 | 7.4 |
| 650 | 12.4 | 11.2 | 11.1 | 9.9 | 9.8 | 8.7 |
| Reduction in forage DM per Kg concentrate DM (Kg) | 0.5 | 0.4 | 0.3 | 0.2 | 0.2 | 0.1 |
Table 5e
Feed intakes for suckler cows
(Hay and Straw)
| – | Hay | Straw | |||
| ME (MJ/Kg DM) | 10 | 9 | 8 | 7.5 | 6.5 |
| Liveweight | Feed intake (Kg Dry Matter per Day) | ||||
| Lactating Cows | |||||
| 450 | 9.0 | 8.1 | 7.4 | 6.7 | 6.1 |
| 550 | 11.0 | 9.9 | 9.1 | 8.3 | 7.4 |
| 650 | 13.0 | 11.7 | 10.7 | 9.8 | 8.8 |
| Dry Cows | |||||
| 450 | 8.1 | 7.4 | 6.8 | 6.1 | 5.6 |
| 550 | 9.9 | 9.1 | 8.3 | 7.4 | 6.9 |
| 650 | 11.7 | 10.7 | 9.8 | 8.8 | 8.1 |
| Reduction in forage DM intake per Kg concentrate DM (Kg) | 0.5 | 0.4 | 0.3 | 0.2 | 0.2 |
Energy Sources for Beef
The use of bought in feeds to supplement the forages fed to beef animals is fascinating. The industry has been able to use a large portfolio of human food industry by-products which are often fed to pigs but can also be fed to intensive beef and finishing diets.
Sucklers may have access to a little concentrates around calving but they tend to be reliant on grazing and or mineral buckets or feed blocks. This suits the extensive systems very well and the upland and hill breeds will thrive on a forage system.
The only issue I have ever had with this is with farmers who seem to think that it’s okay to place a feeding ring in a field and allow a foot or so of “mud” to accumulate around it and watch their stock trudge through the morass in order to get a few mouthfuls of big bale silage!
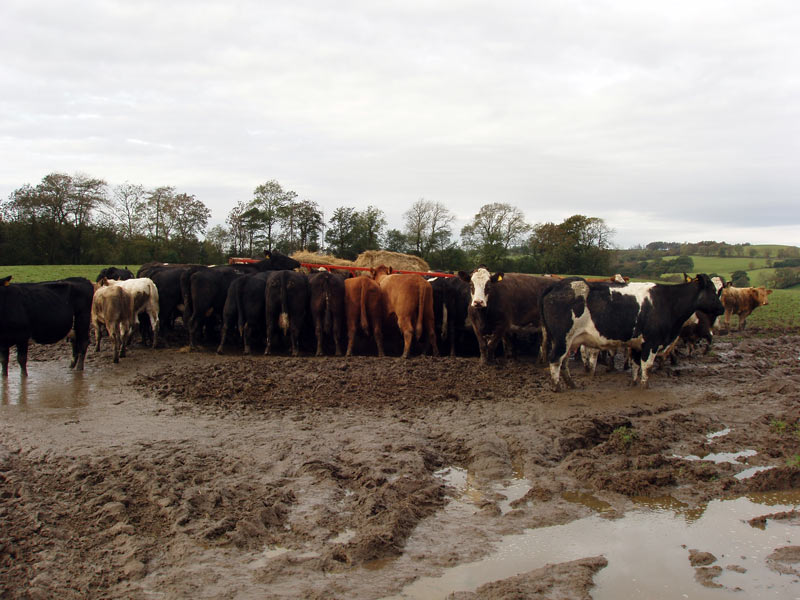
It is a very damaging public image of farming.
It would be far better if they kept moving the ring feeder and allowed clean access to the silage. This would be better for feet and general health and performance; it would also do a great deal to clean up the public image of livestock farming.
Moving on!
The finisher diets and intensive beef diets can use many sources of by-products or they can be traditional.
The barley, soya-based diets are a great benchmark for many farmers and rely on the real quality of the barley and correct addition of a good mineral supplement.
Where some larger units can justify full articulated lorry loads of feed to be brought in, these can be great value for money provided the wastage is kept to a minimum.
Moist feeds in particular tend to ferment and spoil rapidly, The mycotoxin loading from these rotting heaps of feed can be very detrimental to performance and for that reason we strongly advise that farmers using moist feeds should include a good mycotoxin binder in the mix.
Dry feed by-products do not pose the same degree of mould risk (but they are not immune!).
The availability of blended sweet mixes based on bakery and confectionery waste is quite common and can offer good value provided they are balanced with the correct level and quality of protein.
The guidelines for starch and sugar in intensive grower and finisher diets recommend high levels and as a result the rumen can lapse into acidosis at a sub-clinical level as a matter of normality.
We suggest that when these diets are fed, the integrity of the rumen villae is compromised and the absorption of nutrients via the rumen wall is much less efficient.
The overall attraction of the high starch diet is rapid finishing and high energy density relying on large intakes to compensate for lower feed conversion efficiency.
This inherent weakness in the intensive system can be greatly improved by using plenty of structural fibre like chopped straw and chemical buffers along with a yeast all of which have great trial work to prove their effectiveness and financial return.
Energy Requirements for Beef & Suckler Cows
In the UK we use a system known as the Metabolisable Energy system (ME) system.
Energy requirements are based on units of Energy called Megajoules.
These are the equivalent of calories in human nutrition. In order for a ration to be constructed we need to know the daily ME requirements to support the level of performance of the animal and, also the ME contents of the feeds.
There are many publications which give the nutrient values of feeds. Most of them quote the Agricultural Research Council (ARC or NRC) National Research Council (USA) data, upon which most of the industry in the UK bases its rationing activity.
There is a bit of a dilemma in estimating the level of energy required this is due to the fact that the efficiency with which energy is utilised increases as the energy concentration in the diet increases!
In order to avoid hours of tedious calculations, many nutritionists let the computer software do all the tedious work and derive the ration the easy way.
A simple approach is to use the published data and adjust the diet by targeting a total ration energy density.
The energy density or M/D is the number of Megajoules per Kilo of Dry Matter of the diet.
Using M/D allows us to calculate the total amount of energy just by multiplying by the estimated total dry matter intake of the animal (from tables 5 a to 5 e).
For example:- (see page 14)
A 400 Kilo growing animal fed on good 11 MJ/Kg DM silage
It will consume 8.0 x 11 MJ = 88 MJ
So, if that hasn’t induced a deep sleep by now, you will be relieved to know that since all the hard work has been done, all we have to do is check the relevant tables.
The table below shows a generalisation of how the M/D will relate to various performance levels in differing types of cattle.
Table 6
Final ration M/D and its effect on performance (adjusted figures)
| Designation | Cattle Types |
| A | Continental breed / cross bulls. |
| B | Continental breed / cross steers & British breed / cross bulls. |
| C | Continental breed / cross heifers & British breed / cross steers & Friesian / Holstein bulls. |
| D | British breed / cross heifers & Friesian / Holstein steers. |
| E | Friesian / Holstein heifers. |
Table 6a
Growing and finishing cattle
| Cattle Type > | A | B | C | D | E |
| Daily Gain (Kg) | Predicted ration energy density (M/D) expressed as MJ ME/Kg DM* | ||||
| 0.6 | N/A | N/A | 10.4 | 10.5 | 10.6 |
| 0.8 | N/A | 10.7 | 10.8 | 10.9 | 11.0 |
| 1.0 | 11.2 | 11.3 | 11.4 | 11.5 | 11.6 |
| 1.2 | 11.4 | 11.5 | 11.6 | 11.2 | N/A |
| 1.4 | 11.6 | 11.8 | 12.0 | N/A | N/A |
| 1.6 | 12.0 | N/A | N/A | N/A | N/A |
* – Megajoules of metabolisable energy per kilogram of dietary dry matter.
N/A – Not applicable to this type of cattle.
The figures quoted here are at variance with some other sources of published data.
I have found that certain guidelines have proved somewhat optimistic.
For example:-to gain 0.9 kg per day:
a 400 Kg Continental cross bull needs 78 MJ.**
a 400 Kg British breed cross bull needs 83 MJ***
a 400 Kg Friesian / Holstein bull needs 88 MJ****
** Equivalent to 7.5 Kg dry matter at 10.4 MJ > Corrected to 7. 2 Kg DM at 10.8 MJ
*** Equivalent to 7.5 Kg dry matter at 11.0 MJ > Corrected to 7. 5 Kg DM at 11.0 MJ
**** Equivalent to 7.5 Kg dry matter at 11.7 MJ > Corrected to 7. 8 Kg DM at 11.3 MJ
Note: In reality the higher the M/D the higher the intake so the corrected figures are actually closer to reality.
Table 6b
Suckler Cows
| Predicted ration energy density (M/D) MJ ME/Kg DM | |
| Early lactation | 10 |
| Late lactation | 9 |
| Dry | 8 |
There will be considerable variation in theses figures. Multi Sucklers need much higher density diets up to 11 MJ ME/Kg DM.
The efficiency of energy use is shown clearly by the example on page 13 Continental breeds and crosses are the most efficient, British breeds and crosses are intermediate and the Holstein Friesian cross is the least efficient.
AFRC requirements published in 1990 seem to result in some extreme variations in the calculated energy requirements of some bulls and heifers, in housed or outdoor systems.
I am in broad agreement with the guidelines published by Dr David Allen in 1992. The tables shown below are a useful and practical guide to determining the energy requirements for all beef systems practised in the UK.
The tables do not allow for the effects of compensatory growth in turned out store cattle or for the effects of growth promoting enhancers, like selected yeasts. I have varied some of the figures after reviewing some recent publications generally they are adjusted slightly up.
Table 7
ME requirements of growing cattle (Modified from AFRC)(JJT 2020)
Table 7a
Continental breed/cross bulls
| – | – | MJ ME per day at a daily gain in Kg of: | ||||||||
| Live-weight Kg | Ration M/D | 0.8 | 0.9 | 1.0 | 1.1 | 1.2 | 1.3 | 1.4 | 1.5 | 1.6 |
| 100 | 11 | 32 | 34 | 37 | – | – | – | – | – | – |
| – | 12 | 30 | 32 | 34 | 36 | 39 | 42 | – | – | – |
| – | 13 | 28 | 30 | 32 | 34 | 37 | 39 | 42 | 45 | – |
| 200 | 10 | 49 | 53 | – | – | – | – | – | – | – |
| – | 11 | 47 | 51 | 54 | 56 | 62 | 65 | – | – | – |
| – | 12 | 44 | 47 | 50 | 54 | 58 | 63 | 66 | 70 | 75 |
| – | 13 | – | – | – | – | 54 | 58 | 62 | 66 | 71 |
| 300 | 10 | 65 | 69 | 75 | – | – | – | – | – | – |
| – | 11 | 62 | 65 | 69 | 74 | 79 | 85 | 91 | – | – |
| – | 12 | – | 62 | 66 | 71 | 75 | 79 | 85 | 90 | 96 |
| – | 13 | – | – | – | – | 69 | 74 | 79 | 84 | 90 |
| 400 | 10 | 78 | 85 | 91 | – | – | – | – | – | – |
| – | 11 | 74 | 79 | 84 | 90 | 96 | 103 | 111 | – | – |
| – | 12 | – | 75 | 80 | 86 | 91 | 97 | 103 | 110 | 117 |
| – | 13 | – | – | – | – | – | 91 | 97 | 102 | 109 |
| 500 | 10 | 92 | 98 | 105 | – | – | – | – | – | – |
| – | 11 | 88 | 93 | 99 | 105 | 113 | 121 | 129 | – | – |
| – | 12 | – | 89 | 95 | 100 | 106 | 113 | 120 | 128 | 137 |
| – | 13 | – | – | – | – | – | 106 | 112 | 119 | 127 |
Table 7b
Continental breed/cross steers, and British breed/cross bulls
| – | – | MJ ME per day at a daily gain in Kg of: | ||||||||
| Live-weight Kg | Ration M/D | 0.6 | 0.7 | 0.8 | 0.9 | 1.0 | 1.1 | 1.2 | 1.3 | 1.4 |
| 100 | 10 | 30 | 33 | – | – | – | – | – | – | – |
| – | 11 | 29 | 31 | 34 | 36 | – | – | – | – | – |
| – | 12 | 28 | 30 | 33 | 35 | 38 | 41 | 45 | – | – |
| 200 | 10 | 46 | 49 | 53 | 57 | – | – | – | – | – |
| – | 11 | 45 | 48 | 51 | 55 | 59 | 64 | 69 | 75 | – |
| – | 12 | – | 46 | 49 | 52 | 55 | 59 | 63 | 68 | 73 |
| – | 13 | – | – | – | 49 | 53 | 56 | 60 | 64 | 68 |
| 300 | 9 | 63 | – | – | – | – | – | – | – | – |
| – | 10 | 60 | 65 | 70 | 75 | – | – | – | – | – |
| – | 11 | 57 | 61 | 65 | 70 | 75 | 80 | 87 | 93 | – |
| – | 12 | – | – | 62 | 66 | 70 | 75 | 80 | 86 | 92 |
| – | 13 | – | – | – | – | – | 70 | 75 | 80 | 85 |
| 400 | 9 | 75 | – | – | – | – | – | – | – | – |
| – | 10 | 72 | 77 | 83 | 90 | – | – | – | – | – |
| – | 11 | 69 | 74 | 79 | 84 | 90 | 98 | 105 | 113 | – |
| – | 12 | – | – | 75 | 80 | 85 | 92 | 98 | 106 | 112 |
| – | 13 | – | – | – | – | – | – | 92 | 98 | 105 |
| 500 | 9 | 88 | – | – | – | – | – | – | – | – |
| – | 10 | 84 | 90 | 96 | 103 | – | – | – | – | – |
| – | 11 | 80 | 85 | 91 | 97 | 106 | 113 | 122 | 131 | – |
| – | 12 | – | – | 88 | 94 | 100 | 106 | 116 | 121 | 130 |
| – | 13 | – | – | – | – | – | – | 107 | 114 | 122 |
Missing figures on the tables are, at the higher gains, above the normal potential daily liveweight gains for the type of animal and at the lower gains, below the normal range of typical dry matter intakes.
Table 7c
Continental breed/cross heifers, British breed/cross steers
Friesian/Holstein bulls
| – | – | MJ ME per day at a daily gain in Kg of: | ||||||||||
| Live-weight Kg | Ration M/D | 0.5 | 0.6 | 0.7 | 0.8 | 0.9 | 1.0 | 1.1 | 1.2 | 1.3 | 1.4 | 1.5 |
| 100 | 10 | 29 | 32 | – | – | – | – | – | – | – | – | – |
| – | 11 | 27 | 29 | 32 | 35 | 38 | – | – | – | – | – | – |
| – | 12 | 28 | 30 | 33 | 36 | 39 | 42 | 45 | – | – | – | – |
| – | 13 | – | 28 | 31 | 34 | 37 | 39 | 42 | 45 | – | – | – |
| 200 | 10 | 41 | 48 | – | – | – | – | – | – | – | – | – |
| – | 11 | 43 | 47 | 50 | 55 | 59 | 64 | 70 | – | – | – | – |
| – | 12 | – | – | – | 51 | 55 | 59 | 64 | 69 | 75 | 81 | – |
| – | 13 | – | – | – | – | 52 | 57 | 61 | 65 | 69 | 75 | 82 |
| 300 | 9 | 60 | 65 | – | – | – | – | – | – | – | – | – |
| – | 10 | 57 | 63 | 67 | 73 | – | – | – | – | – | – | – |
| – | 11 | 56 | 60 | 65 | 69 | 77 | 80 | 88 | 97 | – | – | – |
| – | 12 | – | – | 62 | 67 | 72 | 77 | 85 | 91 | 98 | 105 | – |
| – | 13 | – | – | – | – | – | 72 | 77 | 85 | 91 | 98 | 105 |
| 400 | 9 | 73 | 79 | – | – | – | – | – | – | – | – | – |
| – | 10 | 70 | 75 | 81 | 88 | – | – | – | – | – | – | – |
| – | 11 | 66 | 73 | 77 | 85 | 91 | 98 | 108 | 116 | – | – | – |
| – | 12 | – | – | 74 | 80 | 86 | 92 | 99 | 106 | 119 | 129 | 140 |
| – | 13 | – | – | – | – | – | – | 93 | 100 | 107 | 118 | 125 |
| 500 | 9 | 84 | 91 | – | – | – | – | – | – | – | – | – |
| – | 10 | 81 | 87 | 94 | 103 | – | – | – | – | – | – | – |
| – | 11 | 78 | 83 | 90 | 97 | 104 | 119 | 130 | 141 | – | – | – |
| – | 12 | – | – | 86 | 96 | 100 | 106 | 118 | 130 | 140 | 151 | 162 |
| – | 13 | – | – | – | – | – | – | 108 | 115 | 124 | 133 | 143 |
Table 7d
British beef/cross heifers and Friesian/Holstein steers
| – | – | MJ ME per day at a daily gain in Kg of: | ||||||||
| Live-weight Kg | Ration M/D | 0.5 | 0.6 | 0.7 | 0.8 | 0.9 | 1.0 | 1.1 | 1.2 | 1.3 |
| 100 | 10 | 29 | 32 | – | – | – | – | – | – | – |
| – | 11 | 29 | 32 | 35 | 38 | – | – | – | – | – |
| – | 12 | 28 | 30 | 32 | 36 | 39 | 43 | – | – | – |
| – | 13 | – | 30 | 32 | 35 | 37 | 41 | 45 | – | – |
| 200 | 10 | 46 | 49 | – | – | – | – | – | – | – |
| – | 11 | 44 | 47 | 52 | 56 | 62 | 68 | – | – | – |
| – | 12 | – | 46 | 50 | 54 | 58 | 63 | 68 | 76 | 80 |
| – | 13 | – | – | – | – | 55 | 59 | 64 | 68 | 75 |
| 300 | 10 | 59 | 68 | 71 | 78 | – | – | – | – | – |
| – | 11 | 52 | 68 | 73 | 79 | 86 | 95 | – | – | – |
| – | 12 | – | – | 64 | 69 | 75 | 80 | 86 | 93 | 101 |
| – | 13 | – | – | – | – | 71 | 76 | 81 | 87 | 95 |
| 400 | 10 | 72 | 77 | 85 | 93 | – | – | – | – | – |
| – | 11 | 69 | 75 | 82 | 88 | 96 | 104 | 114 | – | – |
| – | 12 | – | 72 | 78 | 83 | 91 | 97 | 105 | 113 | 124 |
| – | 13 | – | – | – | – | – | 91 | 98 | 105 | 114 |
| 500 | 10 | 84 | 91 | 99 | 109 | – | – | – | – | – |
| – | 11 | 80 | 87 | 94 | 101 | 111 | 120 | 131 | – | – |
| – | 12 | – | 84 | 90 | 97 | 104 | 112 | 121 | 131 | 143 |
| – | 13 | – | – | – | – | – | 106 | 112 | 121 | 131 |
Table 7e
Friesian/Holstein Heifers
| – | – | MJ ME per day at a daily gain in Kg of: | |||||||
| Live-weight Kg | Ration M/D | 0.5 | 0.6 | 0.7 | 0.8 | 0.9 | 1.0 | 1.1 | 1.2 |
| 100 | 11 | 30 | 33 | 36 | – | – | – | – | – |
| – | 12 | 29 | 31 | 35 | 38 | 41 | 45 | – | – |
| – | 13 | 28 | 31 | 34 | 36 | 40 | 44 | 47 | 51 |
| 200 | 10 | 47 | 52 | 57 | – | – | – | – | – |
| – | 11 | 46 | 50 | 55 | 60 | 66 | 74 | – | – |
| – | 12 | – | 48 | 52 | 57 | 61 | 67 | 74 | 80 |
| – | 13 | – | – | – | 54 | 59 | 64 | 69 | 75 |
| 300 | 10 | 62 | 68 | 74 | – | – | – | – | – |
| – | 11 | 60 | 65 | 72 | 77 | 85 | 93 | – | – |
| – | 12 | – | 62 | 67 | 74 | 80 | 86 | 94 | 103 |
| – | 13 | – | – | – | – | 75 | 81 | 87 | 95 |
| 400 | 10 | 75 | 82 | 92 | – | – | – | – | – |
| – | 11 | 72 | 78 | 86 | 94 | 104 | 115 | – | – |
| – | 12 | – | 75 | 81 | 88 | 96 | 104 | 114 | 125 |
| – | 13 | – | – | – | – | 89 | 97 | 105 | 114 |
| 500 | 10 | 87 | 95 | 105 | – | – | – | – | – |
| – | 11 | 84 | 92 | 100 | 109 | 119 | 130 | – | – |
| – | 12 | – | 87 | 95 | 104 | 113 | 122 | 132 | 143 |
| – | 13 | – | – | – | – | 105 | 113 | 121 | 132 |
Protein Requirements
Protein is the stuff that meat is made of. The growth of the animal is governed by the relationship between the amount and type of energy in the diet and the amount and type of protein.
There are essentially two types of protein:- Effective rumen degradable protein (ERDP) ( the bit that the rumen bugs can use in order to make more rumen bugs), and Un-degradable protein (UDP)(the protein that doesn’t get degraded in the rumen).
The ERDP fraction generally contains some Non protein Nitrogen (NPN) which is also a potential protein building block for the little rumen microbes to use.
It is important to balance this ERDP with an appropriate source of energy. This energy has to be able to be used by the rumen microbes, ideally at the same rate as they can use the ERDP. The energy is referred to as fermentable energy or FME. The FME is made up of different carbohydrates like sugar, starch, and cellulose from the crude fibre in the diet.
The proportion of ERDP in the ration is directly related to the amount of FME required to utilise it and has been set by the AFRC back in 1992 at 10 grams per Megajoule of fermentable energy in the dietary dry matter. This is still a reasonable guide in 2020.
Without going into detail here, it is important to remember that energy and protein is co-reliant, so when we construct the diet, we have to bear in mind that it is not enough to simply supply enough energy. The best diets will supply enough energy of the right types to optimise the metabolism of the protein in both the rumen and the hind gut.
In order to keep life simple Table 8 shows the requirements of protein for growing cattle to be matched with the energy density of the diet.
In the light of experience my figures are at slight variance with some of the published data. I have found that growing animals actually grow better if the protein contents are a little higher than normally recommended.
This can be easily borne out by comparing the performance of growing stock at the same age on spring grass at say 18% to 22% crude protein and indoor silage-based diets typically at 13% to 14% crude protein.
As a rule of thumb, the list below seems to work really well:
| • 0 weeks to weaning | Milk plus 18% CP pellet or coarse mix creeps fed dry. |
| • Weaning to 200 Kg | Forage plus a 16% pellet or blend to average 16% in the total ration. |
| • 200Kg to 350 Kg | Forage plus a 15% pellet or blend to average 15% in the total ration. |
| • 350Kg to finisher diet | Forage plus a 14% pellet or blend to average 14% in the total ration. |
| • Finisher diet | Forage plus a 12% pellet or blend to average 12% in the total ration. |
These diets work well but for Holsteins it works better at one percent less protein from start to finish and extra energy density if possible.
Table 8a
Crude protein requirements for growing cattle (college notes)
| – | Ration energy density (M/D)( Megajoules per kilo of dry matter) | ||||
| – | 9 | 10 | 11 | 12 | 13 |
| Liveweight | Crude Protein content of the dry matter of the total ration (%) | ||||
| 100 | – | – | 18 | 21 | 24 |
| 200 | – | 14 | 14.5 | 15.5 | 16.5 |
| 300 | 13 | 13.5 | 14 | 15 | 15.5 |
| 300+ | 12 | 13 | 13.5 | 14 | 14.5 |
There are some modifications that can be made to the data in table 8 a. UK breeds can require around 1% less crude protein than the stated values although this should be reviewed against actual performance rates of growth. Check weighing at regular intervals is recommended good practise for all growing cattle in order to make any adjustments necessary to keep to the targeted performance levels.
Table 8b
Protein requirements for housed Suckler Cows (college notes)
| – | Daily weight change (Kg) | Milk Yield (Kg) | Crude Protein (Percentage of DM) |
| Spring Calvers | |||
| Pre-calving | 0.50 | 0 | 14 |
| Suckling | -0.50 | 10-15 | 15-16 |
| Autumn Calvers | |||
| Suckling – Bulling | -0.25 | 10-15 | 15-16 |
| After Bulling | 0.50 | 7-12 | 15 |
Rations for suckler cows will usually supply excess protein especially with cows fed on spring grass and good dairy type silage.
Cows will use energy to remove excess protein out of the body, although most cows are left to graze grass, they have evolved to generally cope with much poorer forage than the farmed pastures that they experience today.
Modern grass pastures have grass varieties that have been bred for productivity and these should be balanced with rougher herbage at the times of the year when they are too high in protein and low in fibre. (Spring and early autumn).