The concepts of ruminant nutrition (dairy, beef and sheep).
The objective of this chapter is to provide more of an understanding of how we can produce rations which will not only satisfy the animals needs but also produce the best performance at the most efficient cost structure.
Fortunately, there is now a whole range of books and computer software available, which contain lists, tables and equations telling us how much of each nutrient we will need, to feed the particular animal we are trying to ration. So, we don’t have to worry about calculating much of the information that we need.
Modern rationing is much more about knowing how to make sense of the computer-generated gobbledygook that is often put in front of us, than actually having to work it all out. No, it is probably wise to get hold of a decent piece of software to do the spade work and learn how to interpret the result.
The bad news is that in order to do this effectively, it is vital that there is a good understanding of what makes a good ration and equally, what makes a bad one. This means that we still need to have a good grasp of the principles involved in ruminant nutrition.
When considering the animals needs, the first thing to think about is “What is the food going to be used for?” It really is a very simple question, but the answer provides all sorts of clues as to how to construct the diet needed.
Scientists refer to this question as “The partition of nutrients”. All this really means is, what does the animal do with its food?
All animals need food to maintain their body systems. Maintenance requirements are the nutrients that the animal needs just to keep itself running healthily and includes the energy needed to move about and keep warm. Maintenance requirements are met before anything else can happen. The animal also uses food for growth (including laying down fat or condition), producing milk and pregnancy.
These four factors are very important and must be taken into account individually when constructing rations. For example, it might sound obvious, but it is no good building a list of requirements for a lactating cow if we forget to add in the nutrients that she needs for growth in her late lactation. This is particularly important for heifers and ewes finishing their first lactation.
Nutrient requirements are normally broken down into the following key elements: –
- Dry Matter Intake (DMI)
- Metabolisable Energy (ME, MPE)
- Protein (CP, MPE ERDP/MPN, DUDP/MPB)
- Minerals & Vitamins
- Water
These nutrient sources are normally sub divided into individual nutrient components.
For example, individual key minerals like calcium, phosphorous, magnesium; or energy sources like starch, sugar and NDF etc, etc.
The animal’s requirements for each nutrient varies according to its level of production.
The most efficient way of feeding the animal is to supply it with exactly the right amount of each nutrient. This is unrealistic, so what happens in practice is that we supply the key nutrients like energy and protein as exactly as possible and then we try to get a “best fit” of all the others.
The use of powerful computer models has made the whole process a lot more effective than it used to be, because the computer can simultaneously calculate all the nutrients required in the diet and find the best mix from the feed materials available.
The main pitfall with the computer is usually the operator! I frequently see examples of computer-generated diets that have been out-dated by changes in the grass, silage or the herd calving pattern; or they relied on inaccurate feed analysis or inappropriate production information. These diets tend to be way off the mark as far as accuracy is concerned and as a result tend to be expensive.
It is generally agreed that the best practise is to reassess the feeding regimes of all the livestock groups at least once a month.
There is also a need to get the boots dirty and go and have a look at what the cows are telling us. The “Cow Signals” system is really an intuitive look at a great stockmanship ideal.
Checking the muck, sorting, rumen fill, hock hygiene, udder condition, cudding rate, cubicle lying, etc etc: can tell us a lot about how well the diet is working but also highlights many other stock management issues.
Feed into Milk (FiM)
In 2002 a new model for rationing dairy cows was introduced. Feed into Milk (FiM) represents 12 years of development from the Metabolisable Protein system (MP model) widely adopted in 1990.
There were changes in most of the prediction equations and there is also a better appreciation of rumen fermentation patterns. As a result, we now have some new terms to think about. In order to fully understand FiM I have decided to explain the old MP model terms since they form the foundation of the new rationing techniques.
I have concluded each section with a description of the relevant FiM model terms. This will make it a lot easier for the reader to get to grips with the language and thinking behind FiM.
Many nutritionists subsequently reverted to a hybridised development of the old MP model because FiM seems to have some limitations with both high and low yielding cows and we finished up using fudge factors just like we always did!
For the record, my Ultramix (2020) program allows me to select from three updated models MP, FiM, and the French PDI. This allows for a better approach to prediction, but we still need to get our boots dirty!
Voluntary Feed Intakes and Dry Matter Intakes
The animals need for food is controlled by its appetite. The daily voluntary feed intake is defined as the amount of feed which is eaten when the animal has access to food on a truly ad-lib basis. This normally means that the animal is allowed the freedom to refuse some of the food on offer and is not forced into clearing up the less palatable remnants.
Each animal’s daily feed intake is expressed as the total daily consumption of food minus the water content of that food. This is referred to as “Dry Matter Intake”. (DMI). Sometimes other definitions are used, “Fresh Weight” or “Bulk” intake being the other commonly used expressions.
DMI is directly proportional to the body weight of the animal. There are several factors which modify the animal’s consumption of food.
- The relative level of production.Stage of Lactation, Milk Yield, or Daily Liveweight Gain
The stage of lactation is very important. There is a lot of recent work that suggests that the management of the changeover from the dry cow /ewe diet to the early lactation diet can have a very significant effect on the speed at which the animal can get up to her maximum DMI during the early weeks of lactation, this will be covered in more detail later. Table 1 (quite old but still good) shows the amount of reduction in the predicted DMI at peak lactation yield (at say 10 weeks,) that the cow will experience in the first weeks of lactation.
Table 1
DMI Correction factors for week of lactation (Vadiveloo & Holmes 1979)
| Week of lactation | DMI as % of predicted peak. |
| 1 | 67 Multiply peak DMI by 0.67 |
| 2 | 78 0.78 |
| 3 | 84 0.84 |
| 4 | 88 0.88 |
| 5 | 91 0.91 |
| 6 | 93 0.93 |
| 7 | 95 0.95 |
| 8 | 96 0.96 |
| 9 | 97 0.97 |
| 10 | 98 0.98 |
| 11 | 99 0.99 |
| 12 | 100 1.00 |
| 13 | 100 1.00 |
| 14 | 100 1.00 |
- Food Conversion Efficiency (FCE) and the condition score of the animal.
“Condition score is more of a consequence of voluntary feed intake than a factor affecting intake”.
FCE is the measure by which we determine how efficiently the animal is utilising its food.
Example 1: –
If we take two bulls eating 11.5 Kg DM per day and over the period of a week one grows by 11.5 kg ad the other by 14 kg; the FCE is the number of kilos of dry matter consumed divided by the number of kilos of live weight gain.
ie Bull number one eats 7 x 11.5 Kg DM and grows 11.5 Kg (80.5 Kg / 11.5 Kg) = FCE 7:1
Bull number two eats 7 x 11.5 Kg DM and grows 14 Kg (80.5 Kg / 14 Kg) = FCE 5.75:1
Bull number two is more efficient than Bull number one
Example 2: –
If we take two Dairy cows one eating 24 Kg DM and giving 36 Kilo’s of milk, and the other eating 20 kg DM and giving 25 litres of milk, if we assume that both cows have stable body weight the FCE is as follows: –
ie Cow number one eats 24 kg DM and gives 36 Kg Milk (36 / 24) = 1.5:1
Cow number two eats 20 Kg DM and gives 25 Kg Milk (25 / 20) = 1.25:1
Cow number one produces more milk per Kg DMI than cow two and is thus more efficient.
Why do cows get fat?
There is an understandable element of confusion on this subject. Some fat cows seem to have low levels of feed intake, others have high levels of intake so how can we make sense of this situation?
Cows get fat for several reasons: –
- They are efficient food converters, some of the highest yielding cows tend to put on condition very easily in late lactation simply because the intake which is not being used for maintenance, milk production or pregnancy is efficiently converted to body condition. These animals can have high intakes
- Thinner cows have a tendency to eat more per unit of bodyweight than fat cows but are more efficient at converting the nutrients into milk rather than growth. They can also have a higher metabolic rate. This means that the whole metabolic system is more active, and consequently needs a greater rate of nutrient throughput to drive it.
- Genetic differences can affect appetite and the tendency to put on condition. The appetite differences between breed of both dairy and beef cows and also breeds of sheep can be enormous. A good example of breed having a definite affect is the Holstein cows which tend to carry less condition than traditional Friesian cows and generally eat more per kilo of body weight.
- 5. Health. Cows suffering from Fatty liver syndrome ie: over fat cows at calving, losing weight rapidly at say 1 Kg per day, can have lower feed intakes which is why they mobilise excessive body reserves when demand is high just after calving. This is thought to aggravate, problems like Ketosis, milk fever, metritis (whites) and mastitis.
- 6. Nutritional balance of the ration. Diets that under supply protein tend to result in lower milk production and or muscle tissue growth and some reduction of intake. Diets that over supply protein tend to encourage mobilisation of fat. This helps to bridge the energy shortfall and allow the animal to make maximum use of the protein. This is particularly noticeable where high levels of By-pass protein are fed, (it could be compared to the “Atkins” diet in human slimming plans).
This protein to energy balance is particularly important when attempting to construct diets to increase milk yields or manage condition, both of which are important areas of husbandry directly concerned with dairy cow fertility, and young stock grower / finisher diets.
It is very important for the good stockman to keep an eye on body condition. With the obvious exception of finishing beef and lambs, most animals thrive better if they are kept in a fit condition.
Young stock diets frequently feed too much starch and result in young immature animals carrying far too much body fat.
Recent research has shown that dairy heifer replacements go on to produce better yields of milk protein if they are prevented from getting too fat in the early stages of growth.
The use of distinctive “Grower” diets and “Finisher” diets designed to avoid these problems, will result in much more effective production from all classes of stock.
3. The palatability of the diet. There are a number of nutrients that can improve palatability when they are already in short supply; these include, Sugar, Salt, Acetic acid. These can combine to give high cluster indexed silage.
Note: –
Well preserved silage with low levels of free acid (High PH and dry 26%+), are likely to be eaten faster than wetter lower PH silages which will require more buffering by Bicarbonate, either from the saliva, or added to the diet.
Equally there are a number of nutrients that will reduce palatability; these include, Butyric acid, Propionic acid, Non-Protein Nitrogen (NPN). These can combine to give a low silage cluster index.
The Scottish Agricultural College (SAC), has identified four main types of grass silage.
The silages are characterised by the pattern and extent of the fermentation that has occurred. The clusters are summarised in table 2 below
Table 2
SAC Cluster Index for silages (Offer et al, 1993)
| Cluster | 1 | 2 | 3 | 4 |
| Fermentation | Bad | Moderate | Good | Very Good |
| Lactic Acid | Low | High | High | Low |
| Residual Sugar | None | Low | Low | High |
| VFA | High | Moderate | Low | Low |
| Amino N % of total soluble N | Low | Moderate | Moderate | High |
| Neutralising value | Low | High | Moderate | Low |
4. The general quality of the diet or “Q” Factor.
This is a simple measurement where Q is equal to the Metabolisable Energy (ME) of the total ingredient dry matter of the diet consumed each day, divided by the Gross Energy (GE) of total dry matter in the diet. For the most part it is reasonable to use a figure of 0.65 for high output systems and 0.55 for extensive systems. Diets with a high Q value tend to encourage higher dry matter intakes.
5. The “D” value of the diet, (The speed of passage of feed through the gut). The “D” value usually refers to a measurement of the digestible organic dry matter (DOMD) of a feed or a ration. The digestibility of a feedstuff is of fundamental importance in assessing the potential value of it as a source of useful nutrients; obviously the lower the “D” value the lower the potential value of the feed as a dietary ingredient.
DOMD can be expressed as a percentage
(1), in the Dry Matter content [DOMD],
(2), in the corrected Dry Matter content [DOMDc], or
(3) in the Oven Dry Matter [DOMDo].
The difference in the three measurements is usually quite small, so it isn’t particularly important which one is used.
High “D” value feeds encourage higher intakes of dry matter.
In the case of spring grass this is not necessarily a good thing! The rumen outflow rate increases, and a higher proportion of the grass enters the hind gut in an un-fermented state. This material is then poorly digested and much of the nutrient is unavailable to the animal.
We often see this as a bubbly scour with un-digested fibre running through it. This condition is usually accompanied by acidosis and there is a need to buffer the diet by adding agents like straw, live yeast and sodium bicarbonate.
Factors 5 & 6 are of fundamental importance to maximising ruminant dietary intakes.
In simple terms as the density of a diet increases so does intake. This fact alone tells us that cows on a reducing plane of nutrition say in late lactation, may actually be forced into a faster decline in production than they need to be.
The graph below illustrates this effect perfectly and I would say that if this is the only thing you remember after reading this text you will have learnt a very valuable lesson indeed.
6. The Neutral Detergent Fibre (NDF) level of the diet [see table 3].
Dry matter intake generally decreases as the NDF fraction of the diet increases, within an accepted normal range.
NDF is the cell wall lignin, hemicellulose and cellulose.
Lignin is virtually undigestible and tough, but this structural fibre is vital to maintain the scratch reflex and keep the rumen churning properly.
Hemicelluloses have a very low utilisable energy value.
Cellulose can contribute significantly to the energy supply.
Table 3
A Guide to the NDF Content in the total dietary DM for Dairy Cows
| Milk Yield (Litres Per Day) | DMI (Kg/Day) | Typical NDF level (G/Kg DM) |
| 500 kg Cow 650 kg Cow | ||
| Dry Cows | 12.0 – 14.0 | 480 |
| < 15 | 15.7 – 17.2 | 450 |
| 15 – 20 | 17.8 – 19.5 | 430 |
| 20 – 30 | 18.0 – 20.8 | 390 |
| 30 – 40 | 19.0 * – 22.1* | 360 |
| > 40 | 20.0 * – 24.0* | 330 ** |
Note: -* TMR and robot systems can increase DMI by up to 2.0 Kg per cow per day.
** It is important to try and keep NDF Levels, no lower than 280 g/Kg DM even in high yield diets, since low levels will impair cudding time and subsequently reduce voluntary intakes.
Most nutritionists now agree that keeping the target level at 340 g/Kg to 360 g/Kg DM is desirable.
Mature grass crops will do nothing to increase intakes. Any farmer who has made stemmy first cut due to consistent delays, (usually brought about by wet weather) will know how hard it is to get high intakes from this material. He will also know how quickly the cows will dry off.
A key target for dairy cows is to make sure that the diet never contains less than 6 kilo’s of NDF.
This is of key importance in the diets of “Close Up” dairy cows (3 weeks pre-calving). We now know that if this target can be achieved along with a metabolizable protein (MP) intake of around 1200 grams, that the fresh calved cow will transition to optimum appetite much better than cows that have not had access to these levels of NDF or MP.
We also now target the fresh calved cows with a minimum of 6 kilo’s of NDF in order to retain optimum intakes and rumen function.
7. Rumen PH and stability.
The ideal Rumen Ph is agreed to be 6.7.
large meals of starch and sugar will result in frenzied activity of the rumen micro flora. A by-product of this activity is the production of various common organic acids, the main ones being acetic acid [Vinegar], butyric, lactic and propionic, this results in a rapid drop in rumen Ph.
If rumen Ph drops below 6.2 it becomes too acid for the fibre digesting cellulytic bacteria to survive so they die off or become dormant and this reduces DMI and productivity.
Low levels of Acetic and Butyric acids are known to encourage the growth of the rumen villae.
If the Ph drops below 5.5 the animal starts to suffer from rumen Acidosis as Lactobacilli become dominant. The rumen recovers slowly after the rapid fermenting energy sources are used up and gradually the cellulytic bacteria re-establish themselves, for a few hours until they are hit again with the next highly fermentable meal. This cannot be sensible when designing feed regimes where a high output is are required.
Symptoms of Sub-Acute Rumen Acidosis (SARA) are sometimes only spotted when clinical symptoms start to become evident.
- Firstly, check the muck. Variable muck (Some thin & some Thick) is common in herds where SARA is a problem. The key symptoms are cases of bubbles in the loose muck along with un-digested forage.
- Secondly look out for evidence of cuds lying around the cubicles.
- Thirdly, some cows will be listless, and their eyes may appear glassy.
- Fourthly, many cows will be suffering from varying degrees laminitis. This may have long term effects on fertility, and yield, since cows with tender feet do not stand as well and take less visits to the feed trough.
- Fifthly tail flicking and wet muck on their backs.
Acid loading in the rumen when TMR is fed will result in fluctuating intakes. If the loading is severe, appetite can be seriously depressed. The animal will resort to lying in the cubicles and cudding in order to allow the Rumen Ph to lift towards 6.7. In extreme cases when this happens the cows may suffer from cases of displaced abomasums as the rumen shrinks due to lack of appetite.
Rumen buffering is an important way of reducing the risk. The preferred method is to add dietary fibre to improve cudding. The risk to this is that as the rumen becomes clogged up with structural fibre, intakes initially improve and then decrease rapidly forcing yields to drop.
Chemical buffers may offer a more efficient solution when fed alongside a more appropriate level of crude fibre. The rate for Sodium Bicarbonate is quoted at 225 grams per cow per day/ Most of the more progressive chemical buffer mixes are around 100 grams per day.
However, these rates may be a long way off the actual levels needed. In severe cases the amounts may be more than double the norm!
Research has also shown that the use of good strains of live yeast promote the populations of lactic acid utilising bacteria. This has been shown to drop the acid loading in the rumen very significantly.
It is now well recognised that the cellulytic breakdown results in a less damaging acid environment in the rumen than that posed by large intakes of Lactic acid such as that produced when large volumes of wet Lactic silage are consumed.
When rapidly fermenting carbohydrates are not balanced with a good physical structural fibre content to encourage cudding (see point 8 below,) rumen Ph is generally too low.
Hence the real need to try and balance diets which achieve a neutral rumen Ph.
In a lactic situation the rumen villae (finger like projections of the rumen wall) are usually damaged to such an extent that absorption of nutrients through the rumen wall may be severely restricted.
Modern diets are featuring an increasing use of yeasts which are known to encourage the growth of Lactic acid utilising bacteria, and strong chemical acidity regulators to maintain a neutral rumen Ph. Research in France in 2002/3 and in the UK in 2005 has produced some good data to support this mode of action.
8. Physical form of the diet.
Diets that are compressed or too finely ground with not enough structural, long fibre tend to depress appetite. The cow and the sheep prefer an open structure which is good for cudding and for large mouthfuls.
Wet silage tends to ball up in the rumen and cannot be digested properly unless it is shredded into a more open structure. Mixing with dry feeds can help to achieve this but it is better to make silages with target dry matters of more than 25 %
The open structure works much better in the drier diets (45% to 50% DM) and in this case can influence total intakes dramatically.
We now know that optimum TMR dry matter is typically around 38%, The practice of compact feeding has shown us that if we pre-soak the concentrate mix of the TMR with the objective of reducing any pellets back to meal. We can add this to the forages in the mix and reduce the animal’s ability to sort their food. This has been shown to increase overall dry matter intakes significantly.
One key area of planning has to be the physical form of the ensiled crop.
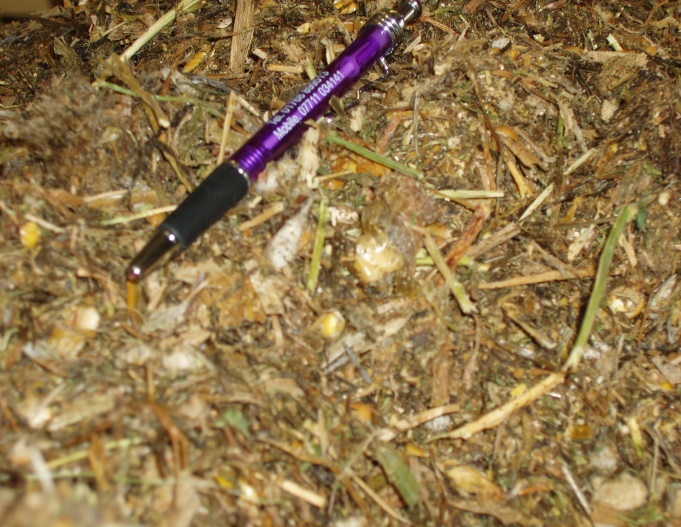
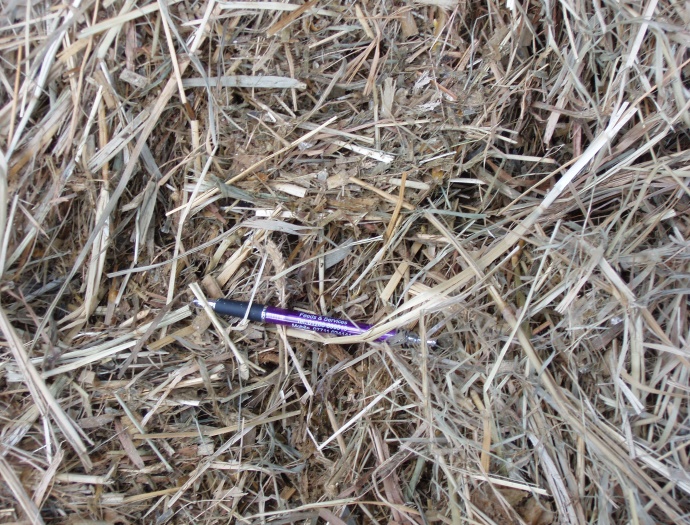
In 2005, 2006 and again in 2008 the author spent some time in the USA and Canada looking at TMR presentation. The chop length of the ensiled forages in these diets was generally no more than 25mm, (1 inch) (pretty short)! These diets were all pretty dry (averaging around 55% dry matter.
The picture on the left shows a Minnesota Dairy TMR for a herd averaging 12000 Kg plus
The picture on the right is a typical US Dry Cow diet.
In the UK we tend to make wetter silages (Okay in 2006 and 2019 we actually made some dry stuff).
When on the wet side we need our chop length to be nearer 40mm because the physical form is floppy, not brittle, and the cudding reflex brought about by scratch factor is dramatically diminished.
At least if the chop length of the wetter silages is on the long side, we stand a better chance of reasonable cudding.
Remember too, that the physical amount of acid being consumed is greater with wetter silages. This means that we actually need a better cudding response with this type of silage. Under these circumstances the nutritionist has to try and dry the diet out by avoiding wet bulk feeds, and usually has to add some chopped straw. In extreme situations it is also necessary to add some chemical buffers like Sodium Bicarbonate.
So, the golden rule is: “If wet cut long and if dry cut short”!
9. Feed System
TMR diets are generally eaten in larger quantities than when the concentrates are fed separately to the forages.
The stability of the rumen is much improved by TMR feeding. It is important to follow the parameters laid down for a good well-balanced diet both nutritionally and physically, if the animal is to perform well.
TMR feeding is likely to result in much better rates of fibre digestion than the consequences of twice a day parlour feeding of concentrates.
It’s amazing how feeding cake twice a day in the parlour can depress intakes!
I have found that where possible starches and sugars should be fed mixed in to the out of parlour forages and the parlour feeds should be highly digestible fibre (HDF) types in order to minimise the disturbing effect that commonly occurs when moderate or high starch cakes are fed .
The high yeilder’s that get fed the largest amounts cake are actually the cows that suffer the most!
Robots are the very best exception to the TMR rule. The highest yields come from frequent milking’s so in order to incentivise the cow, every time she enters the robot to get milked she will be presented with some dairy cake.
This means that the out of parlour TMR should be typically balanced at between 26 and 28 litres per cow. This then allows the cow to be fed enough concentrates little and often which has been shown to boost overall appetite.
DMI is easy to calculate, for most animals it is around 3% of its own body-weight. This will vary according to the factors outlined above. Figures vary from about 1.5% to 4.5% of body weight.
Table 4
Predicted Dry Matter Intakes Of Milking Cows (Kg DM/Day) (ARC, 1980 & MAFF, 1975)
Ration Q value = > 0. 60
Milk Yield (Kg/Day or Litres/Day
| Body Weight (Kg) | 0 | 5 | 10 | 15 | 20 | 25 | 30 | 35 | 40 | 45 | 50 |
| 400 | 10.0 | 10.5 | 11.0 | 11.5 | 12.0 | 12.0 | 12.0 | 12.0 | 12.0 | 12.0 | 12.0 |
| 425 | 10.6 | 11.1 | 11.6 | 12.1 | 12.6 | 12.8 | 12.8 | 12.8 | 12.8 | 12.8 | 12.8 |
| 450 | 11.3 | 11.8 | 12.3 | 12.8 | 13.3 | 13.5 | 13.5 | 13.5 | 13.5 | 13.5 | 13.5 |
| 475 | 11.9 | 12.4 | 12.9 | 13.4 | 13.9 | 14.3 | 14.3 | 14.3 | 14.3 | 14.3 | 14.3 |
| 500 | 12.5 | 13.0 | 13.5 | 14.0 | 14.5 | 15.0 | 15.0 | 15.0 | 15.0 | 15.0 | 15.0 |
| 525 | 13.1 | 13.6 | 14.1 | 14.6 | 15.1 | 15.6 | 15.8 | 15.8 | 15.8 | 15.8 | 15.8 |
| 550 | 13.8 | 14.3 | 14.8 | 15.3 | 15.8 | 16.3 | 16.5 | 16.5 | 16.5 | 16.5 | 16.5 |
| 575 | 14.4 | 14.9 | 15.4 | 15.9 | 16.4 | 16.9 | 17.3 | 17.3 | 17.3 | 17.3 | 17.3 |
| 600 | 15.0 | 15.5 | 16.0 | 16.5 | 17.0 | 17.5 | 18.0 | 18.0 | 18.0 | 18.0 | 18.0 |
| 625 | 15.6 | 16.1 | 16.6 | 17.1 | 17.6 | 18.1 | 18.6 | 18.8 | 18.8 | 18.8 | 18.8 |
| 650 | 16.3 | 16.8 | 17.3 | 17.8 | 18.3 | 18.8 | 19.3 | 19.5 | 19.5 | 19.5 | 19.5 |
| 675 | 16.9 | 17.4 | 17.9 | 18.4 | 18.9 | 19.4 | 19.9 | 20.3 | 20.3 | 20.3 | 20.3 |
| 700 | 17.5 | 18.0 | 18.5 | 19.0 | 19.5 | 20.0 | 20.5 | 21.0 | 21.0 | 21.0 | 21.0 |
| 725 | 18.1 | 18.6 | 19.1 | 19.6 | 20.1 | 20.6 | 21.1 | 21.6 | 21.8 | 21.8 | 21.8 |
| 750 | 18.8 | 19.3 | 19.8 | 20.3 | 20.8 | 21.3 | 21.8 | 22.3 | 22.5 | 22.5 | 22.5 |
Note DMI drops by around 20% for dry cows and low yielders, on diets where Q drops to 0.50. This would be very much in line with the results expected from Higher levels of NDF.
Q 0.65 diets in theory, don’t have much effect on the top DMI in Table 4 but well balanced
Table 6
DMI for modern Holsteins.
| Body Weight (Kg) | 0 | 5 | 10 | 15 | 20 | 25 | 30 | 35 | 40 | 45 | 50 |
| 525 | 15.1 | 15.6 | 16.2 | 16.8 | 17.4 | 17.9 | 18.5 | 19.1 | 19.9 | 20.6 | 21.3 |
| 550 | 15.9 | 16.4 | 17 | 17.5 | 18 | 18.6 | 19.1 | 19.8 | 20.5 | 21.2 | 22 |
| 575 | 16.6 | 17.1 | 17.7 | 18.3 | 18.9 | 19.4 | 19.9 | 20.7 | 21.3 | 22 | 22.8 |
| 600 | 17.3 | 17.8 | 18.4 | 19 | 19.6 | 20.1 | 20.7 | 21.5 | 22.3 | 23 | 23.8 |
| 625 | 17.9 | 18.5 | 19.1 | 19.7 | 20.2 | 20.8 | 21.4 | 22.1 | 22.8 | 23.7 | 24.6 |
| 650 | 18.7 | 19.3 | 19.9 | 20.5 | 21 | 21.6 | 22.2 | 22.9 | 23.7 | 24.6 | 25.5 |
| 675 | 19.4 | 20 | 20.6 | 21.2 | 21.7 | 22.3 | 22.9 | 23.6 | 24.5 | 25.4 | 26.3 |
| 700 | 20.1 | 20.7 | 21.3 | 21.9 | 22.4 | 23 | 23.6 | 24.3 | 25.3 | 26.2 | 27.1 |
| 725 | 20.8 | 21.4 | 22 | 22.5 | 23.1 | 23.7 | 24.3 | 24.8 | 26.1 | 26.9 | 27.8 |
| 750 | 21.6 | 22.2 | 22.8 | 23.3 | 23.9 | 24.5 | 25 | 25.6 | 26.9 | 27.6 | 28.5 |
TMR diets can make a nonsense of these figures. I have had plenty of first-hand experience of cows eating fully 24 Kg of dry matter as a herd, and individuals eating over 30 Kg!
The list of correction factors below should always be used in assessing a more realistic level of DMI for dairy cows.
In the same way, beef and sheep systems can also be affected. It is a fairly logical conclusion that the more palatable, higher quality, better presented and the less competition there is; the dietary intakes of all classes of ruminant will tend to be maximised.
Tip:- Don’t forget the importance of NDF, getting this one wrong will have serious effects.
FiM
FiM has had very little effect on the new intake predictions, so most nutritionists agree that the Vadiveloo & Holmes prediction are still a reasonable base.
The values shown in table 4 have often been looked at in relative disbelief!
The cow referred to in this table is a typical 1970’s British Friesian. I think that when you think about it the figures become more realistic.
As a matter of interest, when the Feed into Milk committee looked into the dry matter intake prediction in 2002, they found that the correction factors proved by Vadiveloo & Holmes shown in table 1 for stage of lactation, were still accurate; and the correction factor shown for Holsteins in table 6 above, was generally accepted as being normal for modern British black and white Holstein dairy cows.
Table 5
Correction Factors
It would be unrealistic to ignore the affects of the following list of husbandry situations.
| Situation | Correction Factor (Multiply By) | Comment |
| Complete Diet (TMR) | 1.1 -1.2 | Need well balanced diet |
| Breed (Holsteins) on TMR | 1.15 | Bigger gut capacity (Table 6) |
| Robots and TMR | 1.15 | Treat as Table 6 |
| Friesians | 1.0 | Standard cow (1975) |
| Modern Ayrshires | 1.0 | Check the actual body weights |
| Mixed Forage Systems | 1.05 | Dependant on the balance |
| Easy feed silage (Forage Box) | 1.0 | Basic system in 1975 |
| Out of Parlour Feeders | 1.05-1.15 | Check the balance |
| Heifers with the main herd | 0.9 | Heifer intakes reduced by bullying |
| Electric fence at silage face | 0.8-0.9 | Check the ease of reach |
| Wet butyric to mouldy dry silage | 0.75-0.9 | Unpalatable appetite depressing |
| Night Lighting | 1.07-1.09 | Helps intakes at night |
| Water at less than 4.0 deg C | 0.95 | Reduces DMI when too cold |
| Dairy Waiting & Non grazing times | 0.9-0.95 | Can reduce eating by 6 hours a day ! |
| Self Feed Silage | 0.95 | Check head space |
Extensive fed mature animals like hill sheep and dry suckler cows, can eat as little as 1.5 % of body weight DMI per day just for maintenance.
Intensively fed high output Holstein dairy cows or bull beef on a high “D” value TMR can eat as much as 4.5 % of body weight DMI per day.
Examples :-
1. The DMI of a 650 Kg cow = 3% of 650 Kg which = 19.5 Kg per day.
This figure could be as high as 3.75% for a mid lactation Holstein cow giving over 45 litres of milk on a TMR system. 650 Kg x 4.0% = 26.00 kg per day. These high yielding cows are a lot more common than they used to be.
2. The DMI of a 45 Kg sheep is 2.5% of 45 Kg = 1.13 Kg.
3. The DMI of a 350 Kg store is 2.5% of 350 Kg = 8.75 Kg
4. The DMI of a 450 Kg intensively finished bull = 3.00% of 450 Kg = 13.50 Kg
That! believe it or not, concludes the first, and some would consider, most important lesson in animal rationing! As you can see, it is not a very precise science, so it is always advisable to check actual figures against the real conditions on the farm and adjust feeding where possible, in order to achieve the best results.